Explore predicted and explanatory variables
Predicted variable: Larceny index
The Larceny Index for a block group would be equal to total number of larceny incidents divided by total population in the block group and then times 100,000. The following hvplot shows larceny index in each block group.
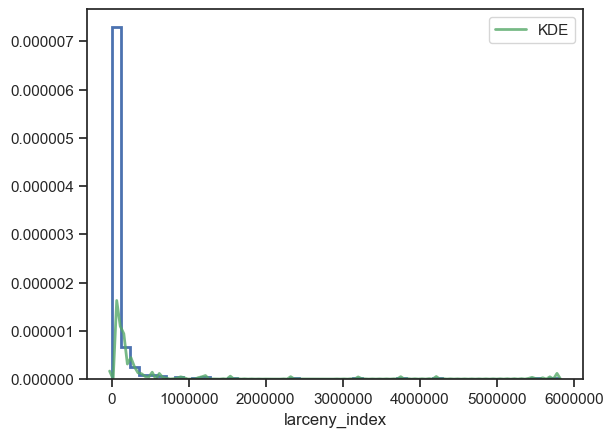
From the histogram of actual larceny index as below, most block groups have larceny index less than 500,000, there are some over 1 million, the maximum even reaches to 6,000,000.
Explanatory variables
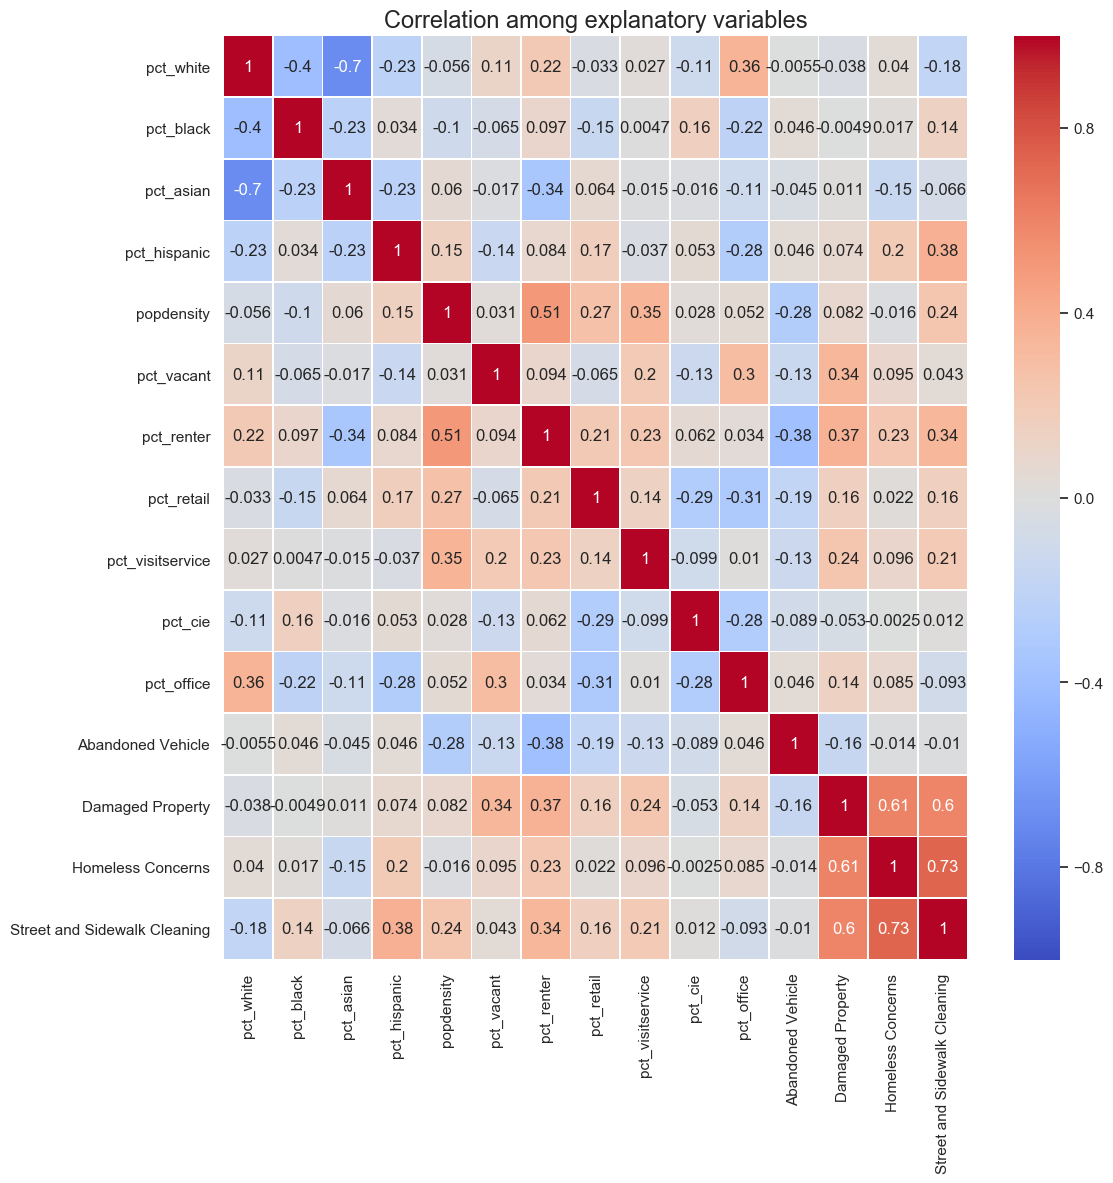
Correlation of all explanatory variables
The absolute values of all correlation indexes are smaller than 0.8, so we considered that all explanatory variables could be included in our model.
Pairplots
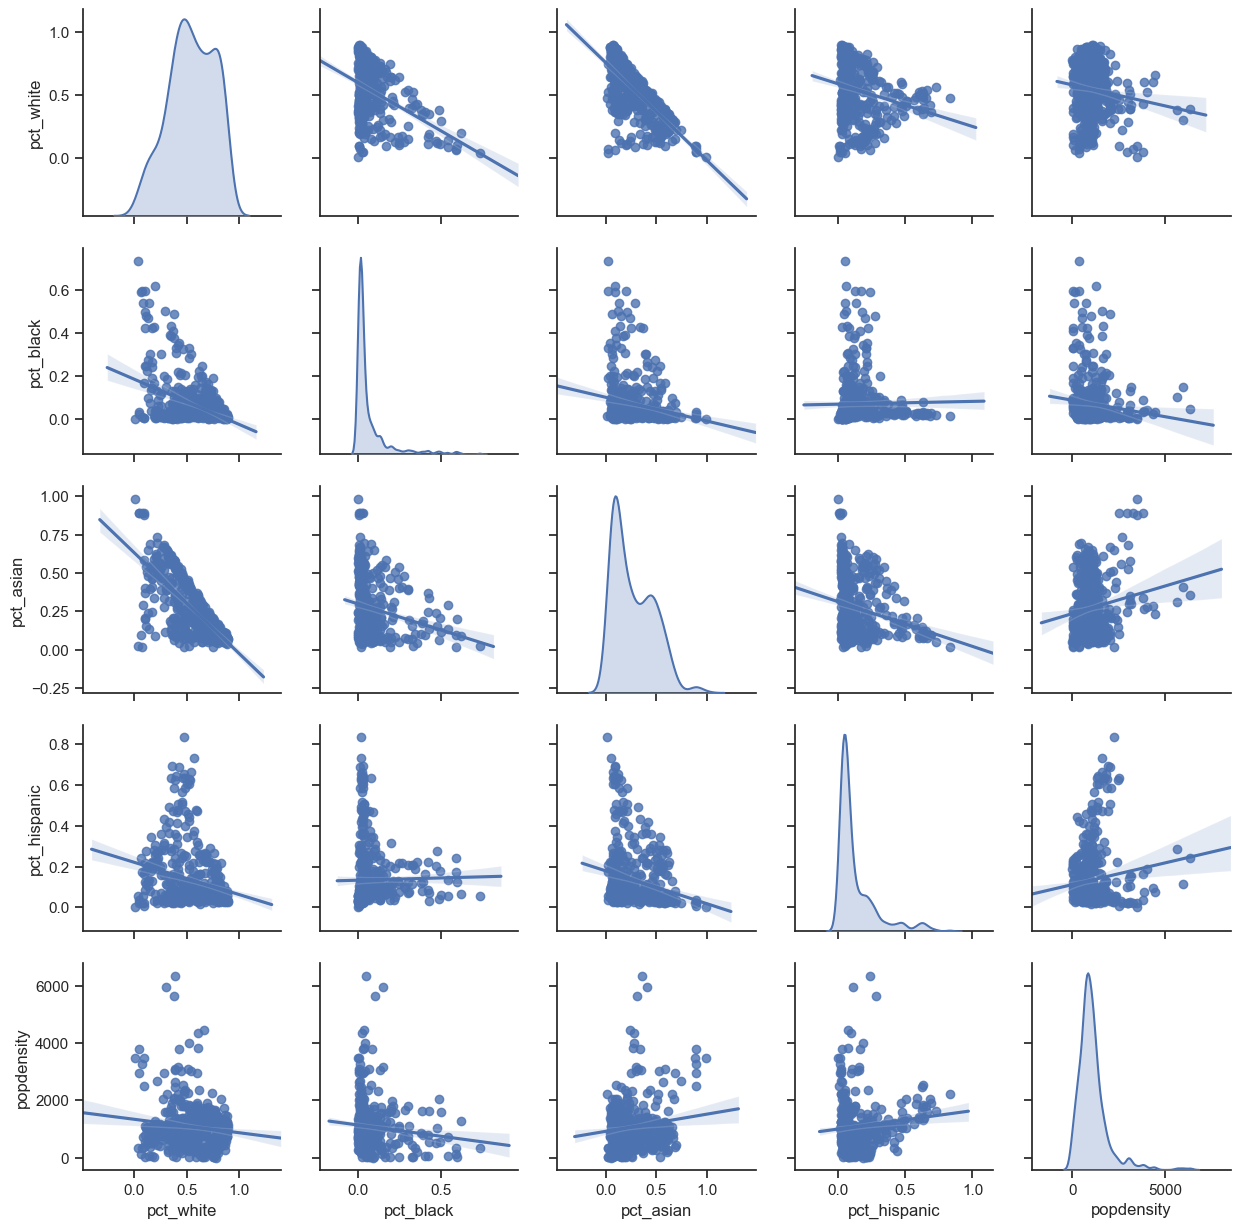
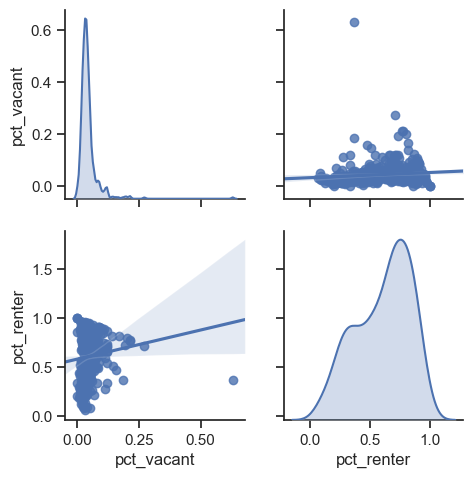
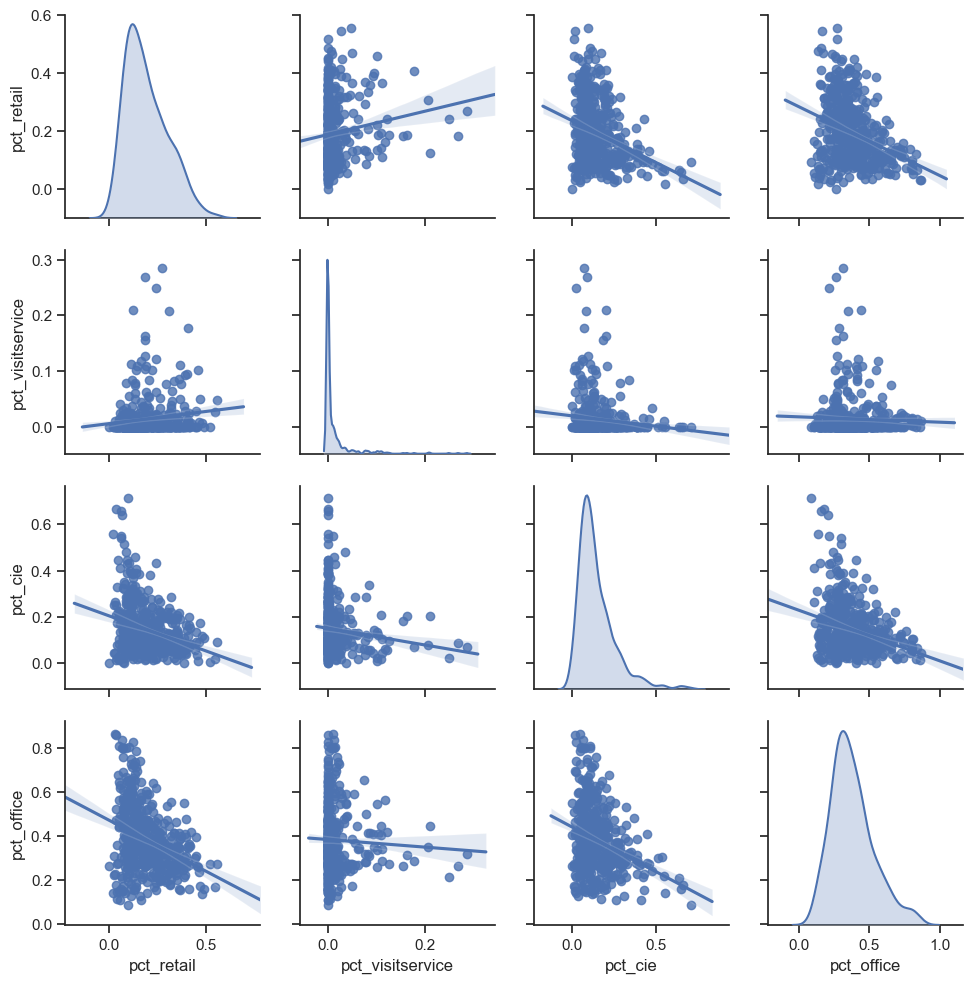
We used pairplots to show the relations between explanatory variables in detail. In this step, we produced the pairplots based on the general categories: demographic, housing, land use, and 311-related.
1. Pairplot of demographic data
2. Pairplot of housing data
3. Pairplot of land use data
4. Pairplot of 311-related data
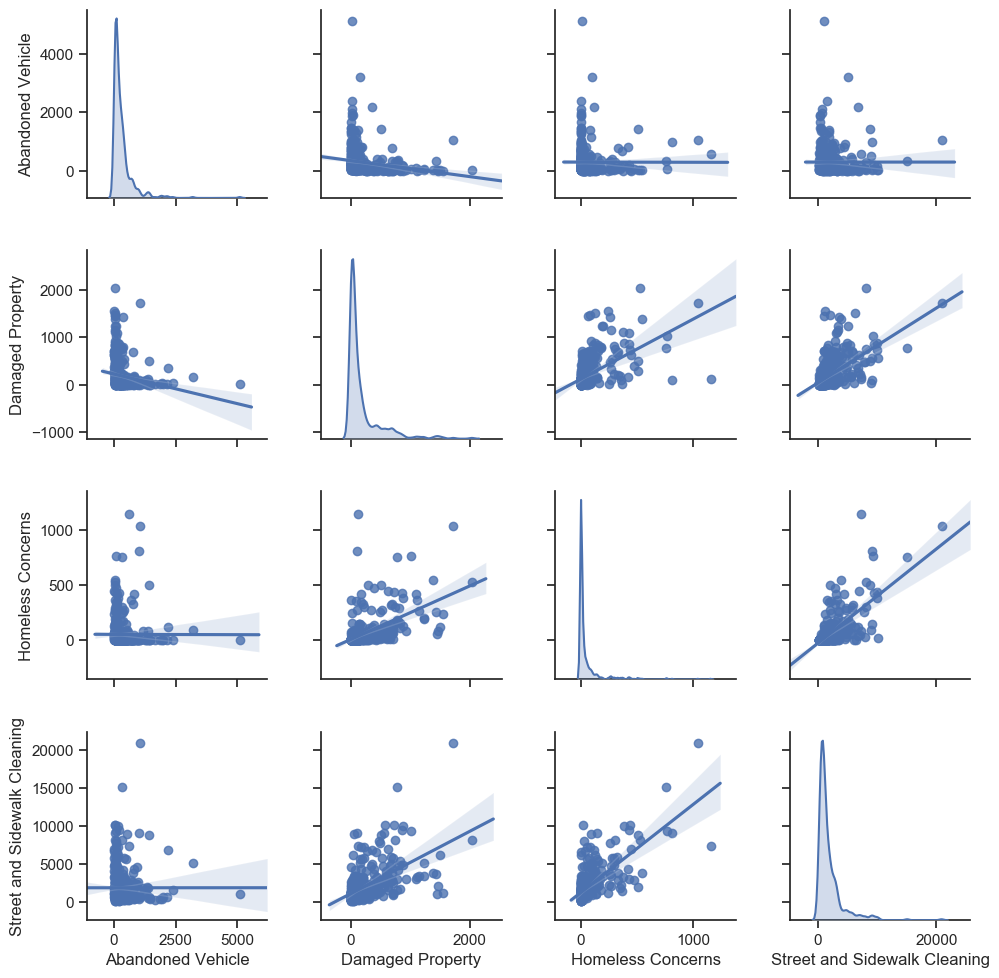
As the above pairplots show, in each general category, there are no two explanatory variables which have obvious linear relationship to each other. Thus, it proves that all explanatory variables could be included in the model without worrying about multicollinearity.