Explore larceny count in San Francisco 2013-May 2018
By year
Larceny count can be summarized by years to see if the number of larcenies had a trend of growth or decrease in the past. For the analysis, we grouped the data by year and calculated the total number of incidents in each year. Then, we plotted a “step” plot for visualization.
In recent years (especially from 2012 to 2017), the number of larceny incidents continued increasing. Since we only got the data for first 5 months of 2018, the decrease from 2017 to 2018 in the graph is not useful for implication.
By block groups
Larceny count can also be summarized in each block group by years.To do this, we firstly converted the data with datetime parameters. Then we counted the number of incidents in each block group each year. After that, after getting the geometry of the block groups and converted the data to geodataframe, we conducted the visualization shown in the figure below. For example, in 2007, most larceny incidents happened in SOMA (south of Market street) and Union Square areas.
Scroll the bar to get the change of larceny count by year for each block group
By census tracts and type
We also created an interactive visualization of the total number of larceny incidents in each census tract from 2003 to May 2018 by using a widget to classify the violation types. We found that from 2003 to May 2018, larceny incidents of “ATTEMPTED AUTO STRIP” happened mostly commonly in the Financial District area.
Use the dropdown to get the change of larceny count by type for each census tract
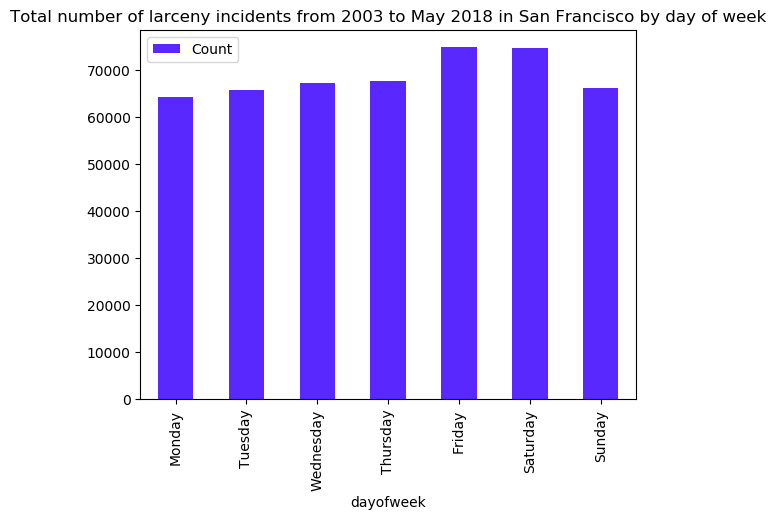
By day of week
We wanted to check if there’s a distribution pattern of larceny incidents in each day or some days per week. So, we grouped the data and calculated the number of larceny incidents by day of week. Afterwards, we reordered the dataframe in the order from Monday to Sunday and used Matplotlib to produce a bar chart for the reordered data.
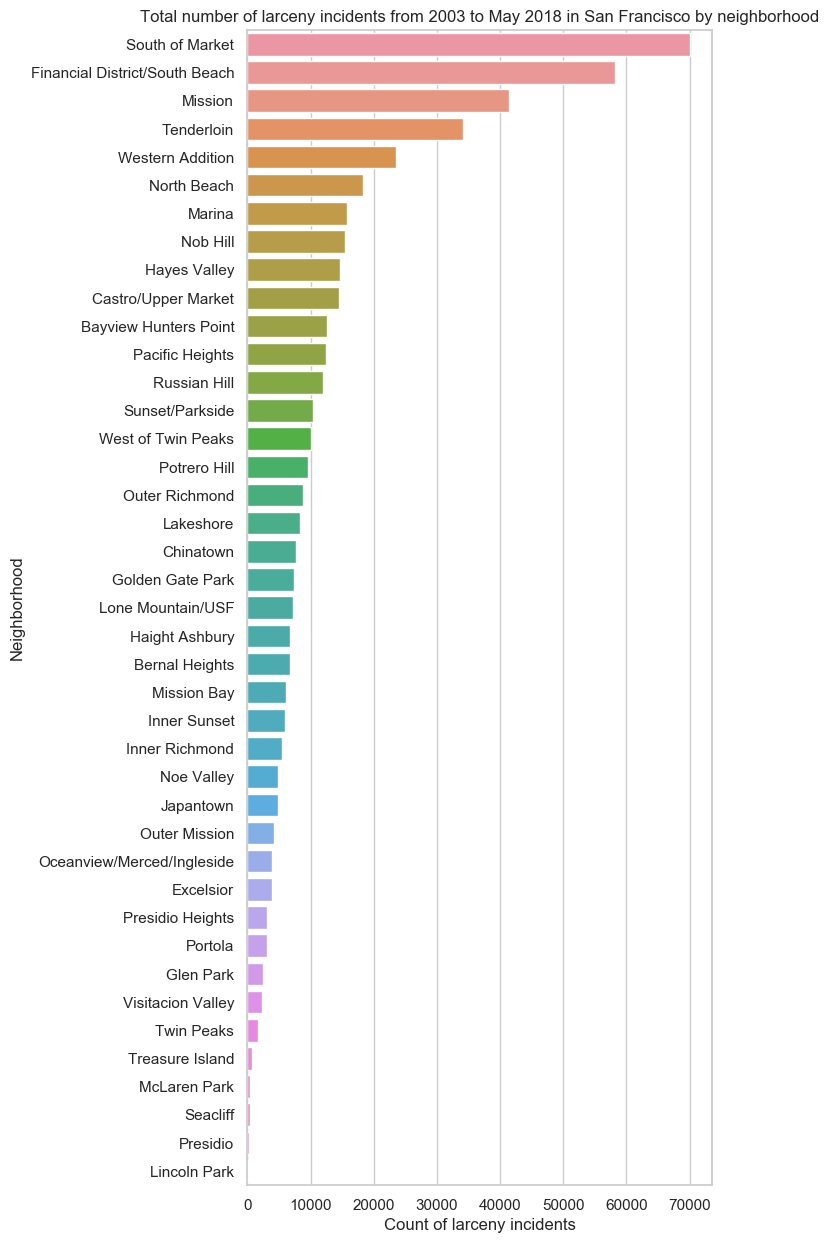
By neighborhood
Summarized by neighborhoods, the first 4 neighborhoods most vulnerable to thefts are South of Market (70,100), Financial District/South Beach (58,197), Mission (41,448), and Tenderloin neighborhood (34,142). In fact, the number of SOMA is more than twice of Tenderloin! On its opposite, Lincoln Park, Presidio, Seacliff, and McLaren Park (The number of larcenies in these neighborhoods are smaller than 500!) are the 4 safest neighborhoods to larcenies in SF.
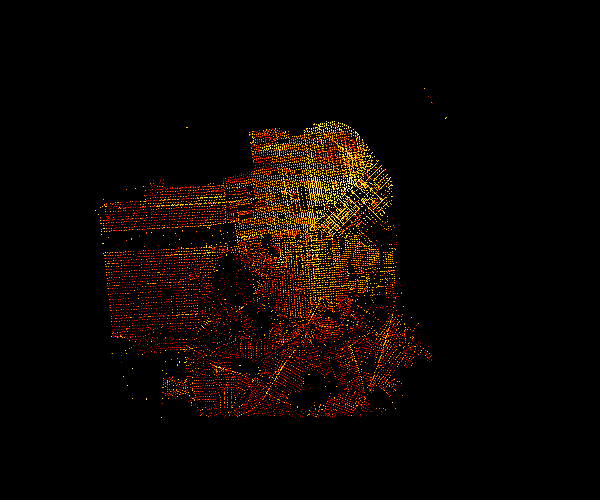
Datashade: Density of larceny count
We got totally 480,448 larceny cases from the dataset and we visualized the preliminary view of the density of larceny incidents happened in San Francisco by using datashader package to aggregate the crime points and shade the aggregated pixels.
It is clear to notice that the northeastern part of the city (Chinatown, financial district and Tenderloin neighborhood) seems to have the highest density of larceny incidents in the past.