Modeling results
Importance of explanatory variables
We visualized the feature importance of the variables as below. According to the hvplot, we found that percentage of vacant housing units and population density in each block group are the two most important variables to improve our model’s fitness.
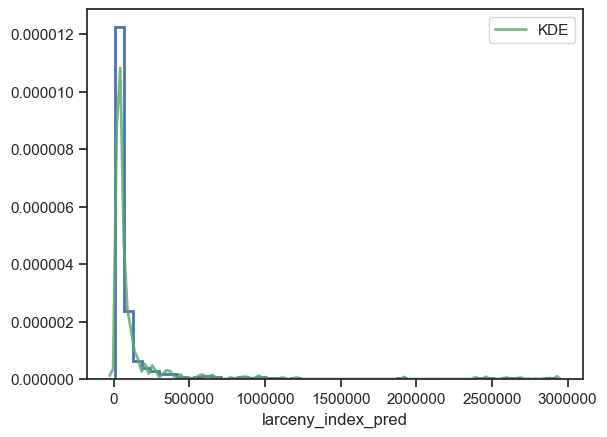
Predicted larceny index
We plotted the predicted larceny indexes by block groups as below. The deeper the color, the higher the possibility the larcenies would happen. We found that the areas with high larceny indexes kept their high potential of larceny incidents in the prediction. Moreover, Presidio and Hunters Point areas seem to have high potential for the happening of larcenies as well even though not many larceny incidents happened in these two places in the past.
From the histogram of predicted larceny index as below, the predicted results are largely 500,000 with only a few over 1 million.
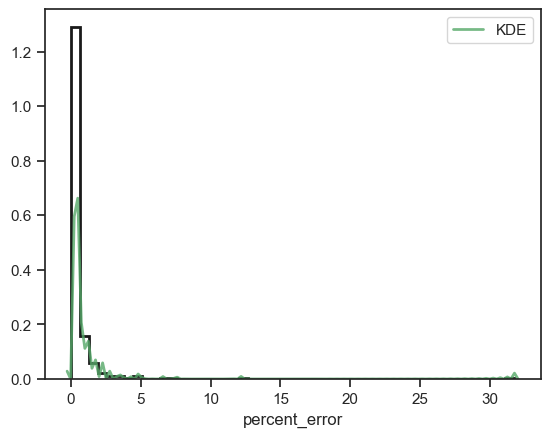
Absolute percent error
Last but not least, we plotted the absolute percent error of predicted larceny index by block groups. In the map, the deeper the color, the higher the percent error it is, and the high percent errors means the relatively low accuracy of prediction in these areas. Thus, the predictions of larceny indexes at Presidio, Hunters Point, Golden Gate Park, and Lake Merced Park may not be as convincible as the predictions in other places. However, after all, we could be sure that the northeastern part of SF will still have lots of larceny incidents in the future.
From the histogram of absolute percent error as below, the values of absolute percent error are mostly within 5%, but there are also extreme value which is over 30%.